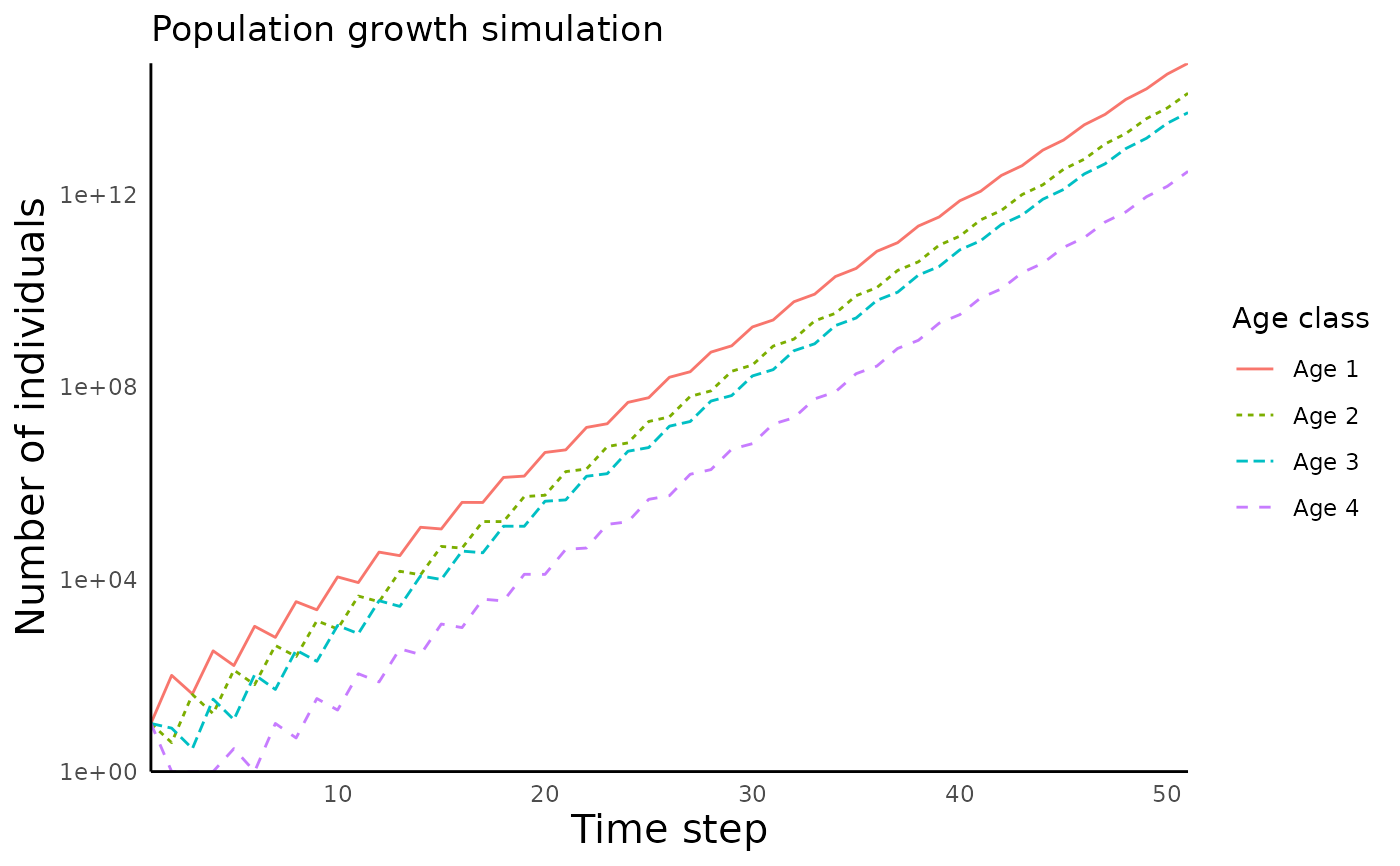
Generate a trajectory of population size in each (st)age over time
plot_structured_population_size.RdGenerate a trajectory of population size in each (st)age over time
Arguments
- pop_growth_matrix
population growth matrix, as generated by
run_structured_population_simulation(each row is an age class and each column is a time step)
See also
run_structured_population_simulation() to simulate the growth of a
structured population given a Leslie matrix,
plot_structured_population_agedist() and
plot_structured_population_lambda() for plotting different aspects of the
population trajectory, and plot_leslie_diagram() for plotting an
transition diagram based on the specified Leslie matrix
Examples
leslie_matrix <- matrix(c(0, 8,1, 1, 0.4,0,0,0,0,0.8,0,0,0,0,0.1,0),
ncol = 4, byrow = TRUE)
structured_pop_init <- c(10,10,10,10)
structured_pop_time <- 50
structured_pop_out <- run_structured_population_simulation(leslie_mat = leslie_matrix, init =
structured_pop_init, time = structured_pop_time)
plot_structured_population_size(structured_pop_out)
#> Warning: Transformation introduced infinite values in continuous y-axis