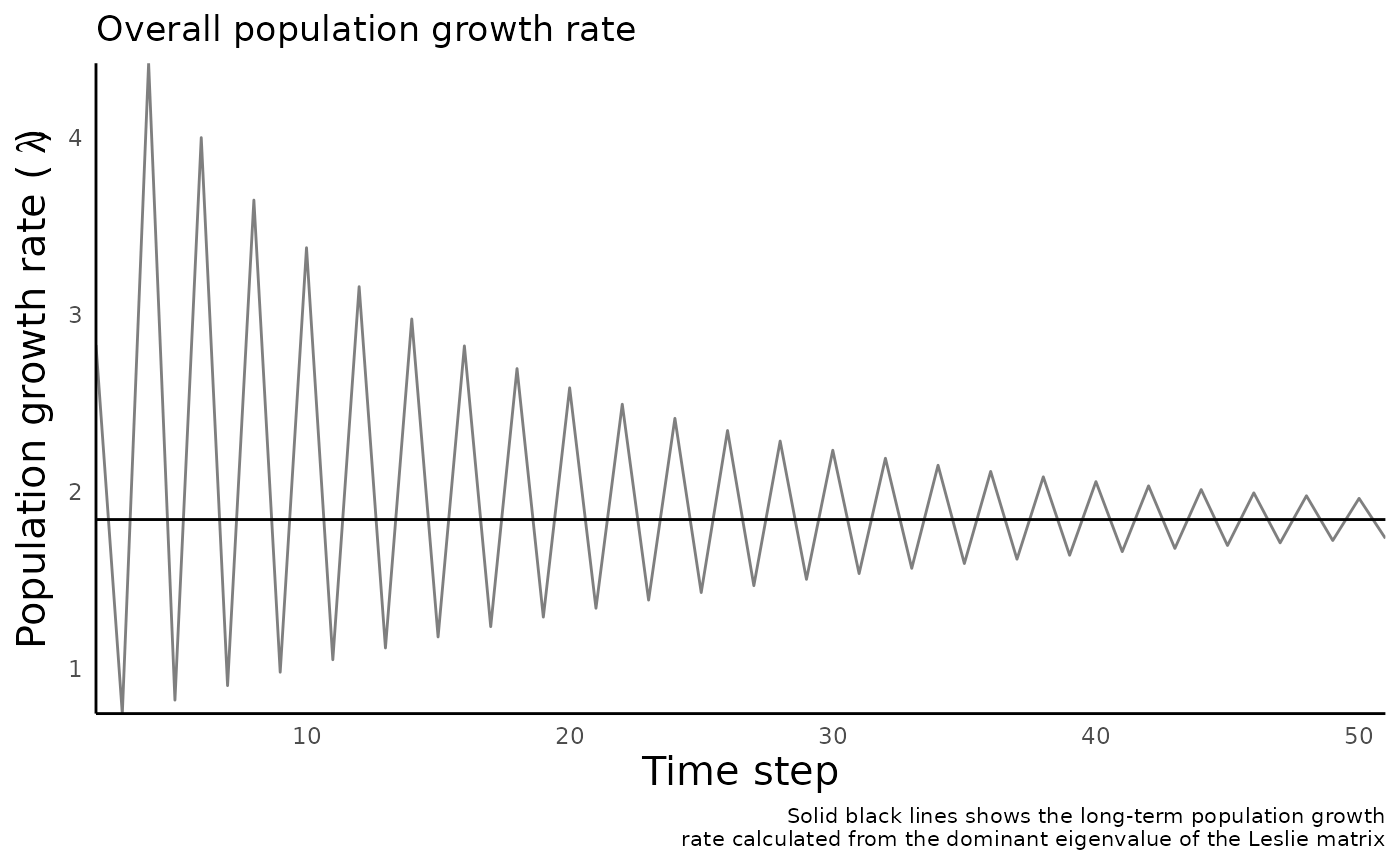
Generate a trajectory of the total population size over time
plot_structured_population_lambda.RdGenerate a trajectory of the total population size over time
Arguments
- pop_growth_matrix
population growth matrix, as generated by
run_structured_population_simulation(each row is an age class and each column is a time step)- leslie_mat
Leslie matrix used to generate the population trajectory (optional). If the Leslie matrix is provided, the trajectory also includes lines indicating the stable age distribution
See also
run_structured_population_simulation() to simulate the growth of a
structured population given a Leslie matrix,
plot_structured_population_size() and
plot_structured_population_agedist() for plotting different aspects of the
population trajectory, and plot_leslie_diagram() for plotting an transition
Examples
leslie_matrix <- matrix(c(0, 8,1, 1, 0.4,0,0,0,0,0.8,0,0,0,0,0.1,0),
ncol = 4, byrow = TRUE)
structured_pop_init <- c(10,10,10,10)
structured_pop_time <- 50
structured_pop_out <- run_structured_population_simulation(leslie_mat = leslie_matrix, init =
structured_pop_init, time = structured_pop_time)
plot_structured_population_lambda(structured_pop_out, leslie_matrix)