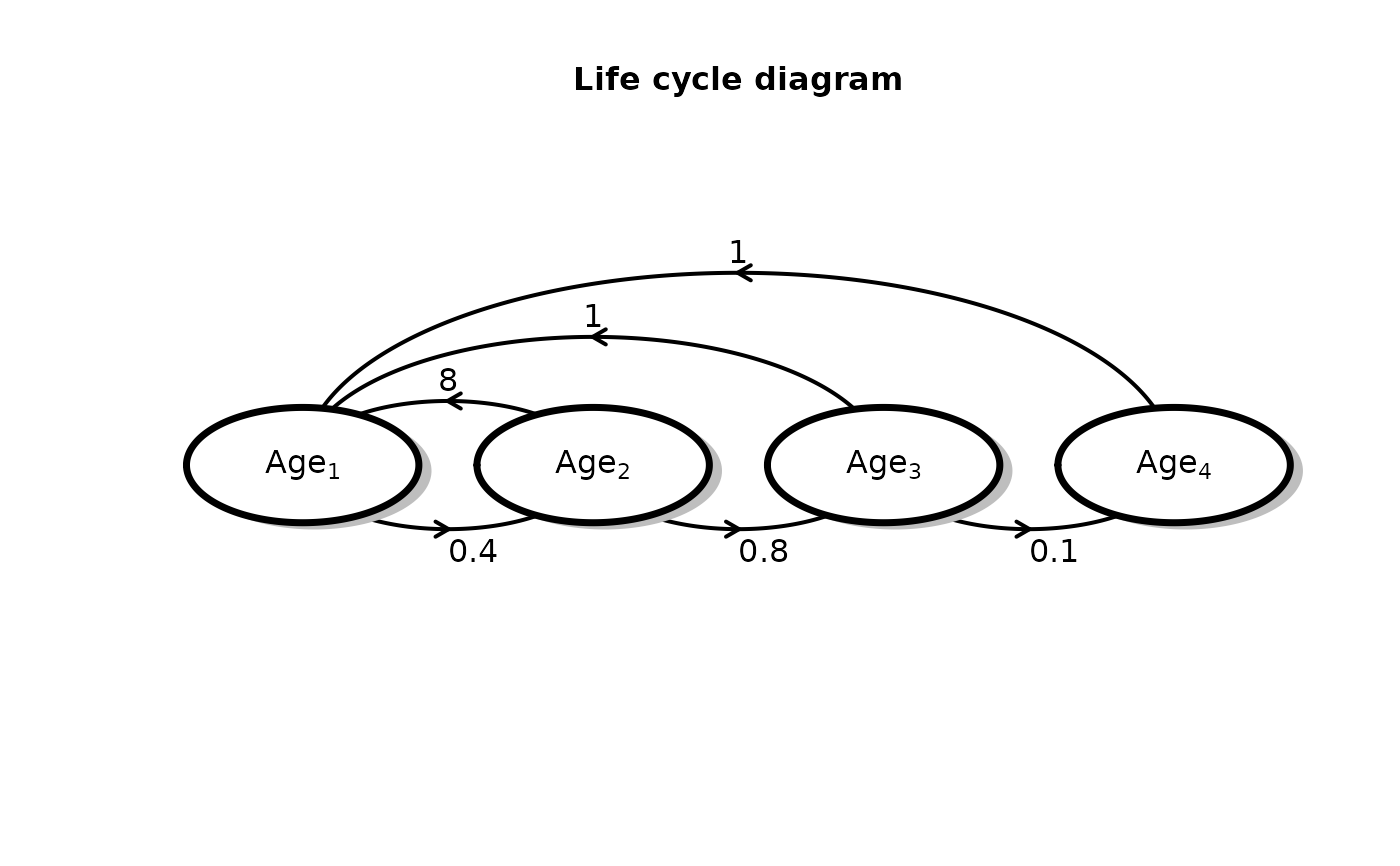
Generate diagram of population structure
plot_leslie_diagram.RdGenerate diagram of population structure
See also
run_structured_population_simulation() to simulate the growth of a
structured population given a Leslie matrix,
plot_structured_population_size(),
plot_structured_population_agedist(), and
plot_structured_population_lambda() for plotting different aspects of the
population trajectory
Examples
leslie_matrix <- matrix(c(0, 8,1, 1, 0.4,0,0,0,0,0.8,0,0,0,0,0.1,0),
ncol = 4, byrow = TRUE)
plot_leslie_diagram(leslie_matrix)

#> $arr
#>   row col Angle Value   rad    ArrowX    ArrowY TextX TextY
#> 1   2   1     0   0.4 0.125 0.2494110 0.2750014 0.250 0.255
#> 2   1   2     0     8 0.125 0.2501963 0.5249998 0.250 0.545
#> 3   3   2     0   0.8 0.125 0.4994110 0.2750014 0.500 0.255
#> 4   1   3     0     1 0.250 0.3753927 0.6499997 0.375 0.670
#> 5   4   3     0   0.1 0.125 0.7494110 0.2750014 0.750 0.255
#> 6   1   4     0     1 0.375 0.5005890 0.7749995 0.500 0.795
#>
#> $comp
#>          x   y
#> [1,] 0.125 0.4
#> [2,] 0.375 0.4
#> [3,] 0.625 0.4
#> [4,] 0.875 0.4
#>
#> $radii
#>        x         y
#> [1,] 0.1 0.1124309
#> [2,] 0.1 0.1124309
#> [3,] 0.1 0.1124309
#> [4,] 0.1 0.1124309
#>
#> $rect
#>      xleft      ybot xright      ytop
#> [1,] 0.025 0.2875691  0.225 0.5124309
#> [2,] 0.275 0.2875691  0.475 0.5124309
#> [3,] 0.525 0.2875691  0.725 0.5124309
#> [4,] 0.775 0.2875691  0.975 0.5124309
#>
#> $arr
#> row col Angle Value rad ArrowX ArrowY TextX TextY
#> 1 2 1 0 0.4 0.125 0.2494110 0.2750014 0.250 0.255
#> 2 1 2 0 8 0.125 0.2501963 0.5249998 0.250 0.545
#> 3 3 2 0 0.8 0.125 0.4994110 0.2750014 0.500 0.255
#> 4 1 3 0 1 0.250 0.3753927 0.6499997 0.375 0.670
#> 5 4 3 0 0.1 0.125 0.7494110 0.2750014 0.750 0.255
#> 6 1 4 0 1 0.375 0.5005890 0.7749995 0.500 0.795
#>
#> $comp
#> x y
#> [1,] 0.125 0.4
#> [2,] 0.375 0.4
#> [3,] 0.625 0.4
#> [4,] 0.875 0.4
#>
#> $radii
#> x y
#> [1,] 0.1 0.1124309
#> [2,] 0.1 0.1124309
#> [3,] 0.1 0.1124309
#> [4,] 0.1 0.1124309
#>
#> $rect
#> xleft ybot xright ytop
#> [1,] 0.025 0.2875691 0.225 0.5124309
#> [2,] 0.275 0.2875691 0.475 0.5124309
#> [3,] 0.525 0.2875691 0.725 0.5124309
#> [4,] 0.775 0.2875691 0.975 0.5124309
#>