Function for plotting phase portrait of predator-prey model
plot_predprey_time.RdFunction for plotting phase portrait of predator-prey model
See also
run_predprey_model() for simulating the dynamics of a
predator-prey system, and plot_predprey_portrait() for making portrait
plots of the predator and prey (including visualizations of the ZNGIs)
Examples
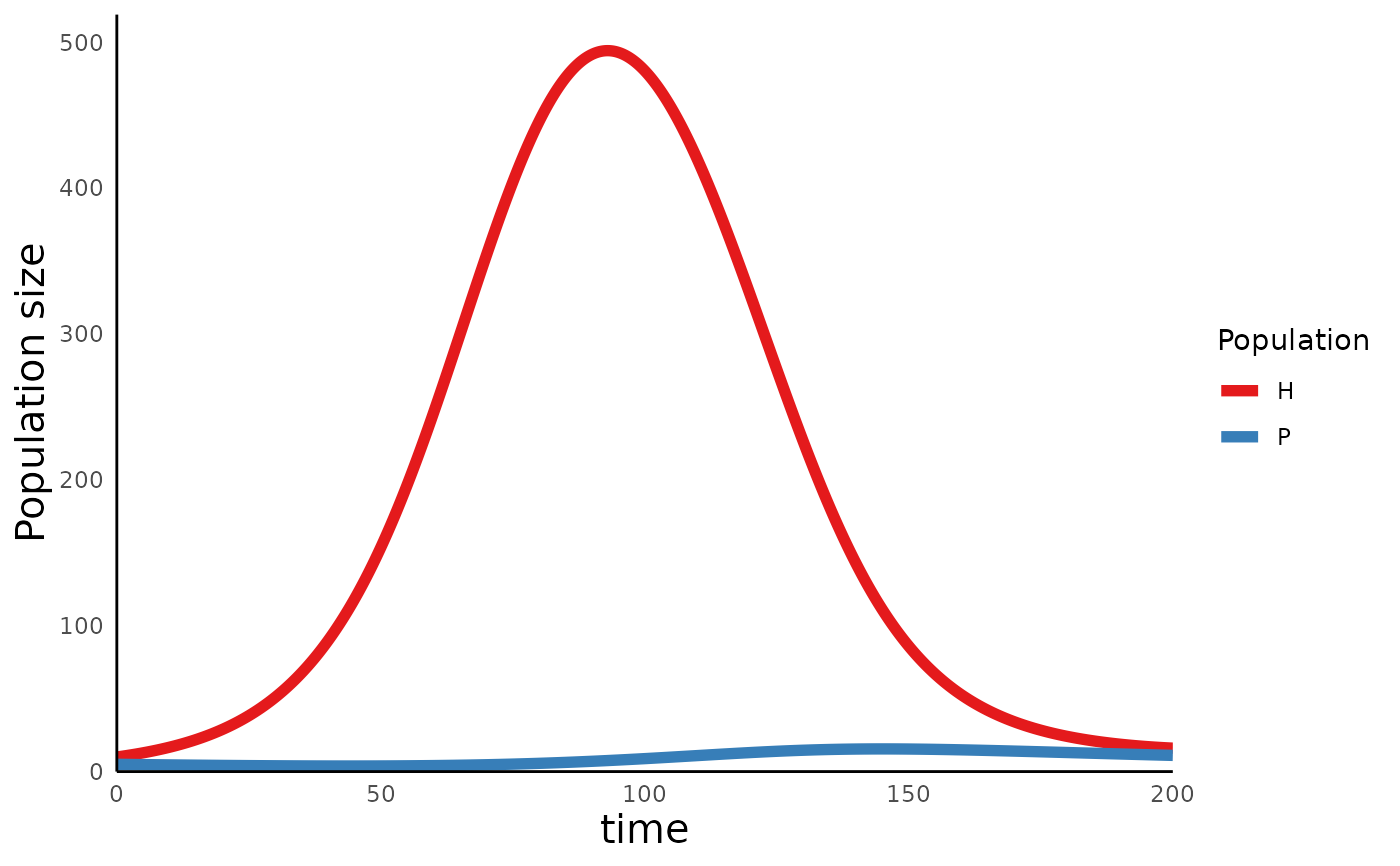
# Define parameters for the Rosenzweig-Macarthur model:
params <- c(r = .1, a = .01, e = .01, d = .01, K = 1000, T_h = .1)
sim_df <- run_predprey_model(200, init = c(H = 10, P = 5), params = params)
plot_predprey_time(sim_df = sim_df)