Function for plotting phase portrait of predator-prey model
plot_predprey_portrait.RdFunction for plotting phase portrait of predator-prey model
Arguments
- sim_df
data frame generated from run_XXX
- params
parameter values used to generate
sim_df- vectors_field
set to TRUE to see the vector field under the phase portrait
- ...
additional arguments to pass to plot_vector_field (mostly this is the density of the vector field, set by vec_density)
See also
run_predprey_model() for simulating the dynamics of a
predator-prey system, and plot_predprey_portrait() for making portrait
plots of the predator and prey (including visualizations of the ZNGIs)
Examples
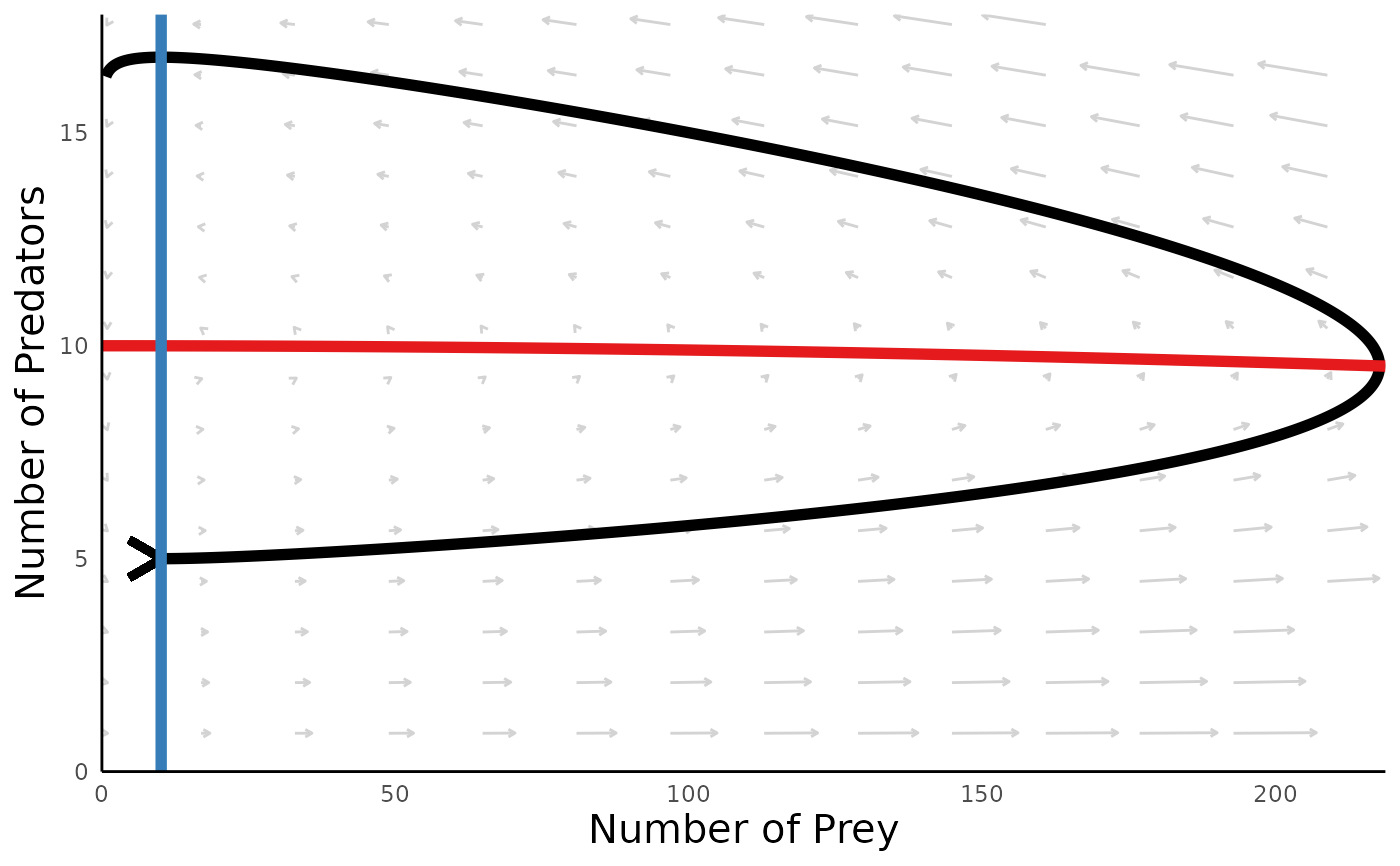
# Define parameters for the Rosenzweig-Macarthur model:
params <- c(r = .1, a = .01, e = .01, d = .001, K = 1000, T_h = .1)
sim_df <- run_predprey_model(200, init = c(H = 10, P = 5), params = params)
plot_predprey_portrait(sim_df = sim_df, params = params, vectors_field
= TRUE)
#> Warning: Removed 196 rows containing missing values (geom_segment).