Plot population trajectories over time for mutualism model
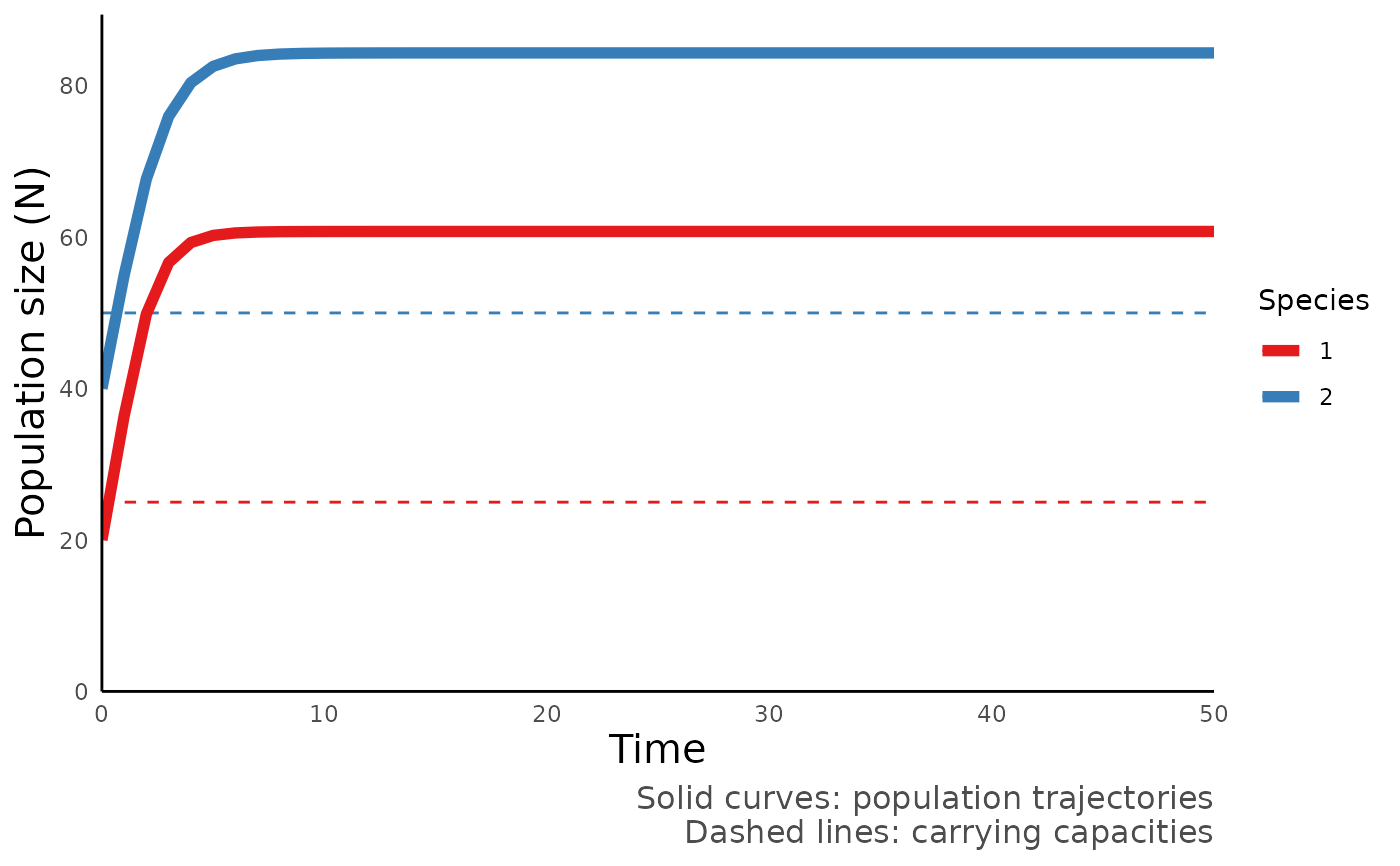
plot_mutualism_time.RdGenerate a plot of trajectories of population sizes over time for the model of mutualism with saturating functional response.
Arguments
- sim_df
Data frame of mutualism model simulation returned by
run_mutualism().
Value
A ggplot object with trajectories of population sizes (N1, N2) plotted
against time. Population carrying capacities for each species, calculated
from model parameters, are also plotted.
Note
The plot generated with this function is constrained to display only the
first quadrant (i.e. values of 0 and above) of the plane defined by N and
time because negative values of N or time do not make biological sense.
As a consequence, when sim_df is generated using negative values for r1
and/or r2, the corresponding lines for population carrying capacities will
not be visible in the plot because they will lie beyond the plot's limits.
Examples
sim <- run_mutualism()
plot_mutualism_time(sim)