Plot phase portrait for mutualism model
plot_mutualism_portrait.RdGenerate a phase portrait for the model of mutualism with saturating functional response.
Arguments
- sim_df
Data frame of mutualism model simulation returned by
run_mutualism().- vec
Logical. If
TRUE(default), a vector field will be drawn.- traj
Logical. If
TRUE(default), trajectories of population sizes insim_dfwill be drawn.- ...
Arguments passed on to
mutualism_vector_fieldvec.densityDensity of vectors, specified as a single numeric value larger than 0. e.g. If
vec.density = 20(default), a 20 \(\times\) 20 point grid evenly spaced along each axis is generated, where each grid point is the starting point of a vector.vec.scaleValue to scale magnitude of vectors by, specified as a single numeric value larger than 0. e.g. If
vec.scale = 0.1(default) the magnitude of each vector is 0.1 times the magnitude of the vector produced by runningrun_mutualism()for one time step given each starting point (specified viavec.density) andparams(inherited fromsim_df).
Value
A ggplot object with population sizes (N1, N2) plotted against one
another as a phase portrait. Zero net growth isoclines for each species are
also plotted. Optionally, a vector field and/or trajectories of population
sizes can also be plotted.
Note
The plot generated with this function is constrained to display only the
first quadrant (i.e. values of 0 and above) of the phase plane defined by
N1 and N2 because negative values of N do not make biological sense. As
a consequence, when sim_df is generated using negative values for r1
and/or r2, the corresponding zero net growth isoclines may not be visible
in the plot if they lie largely beyond the plot's limits.
Examples
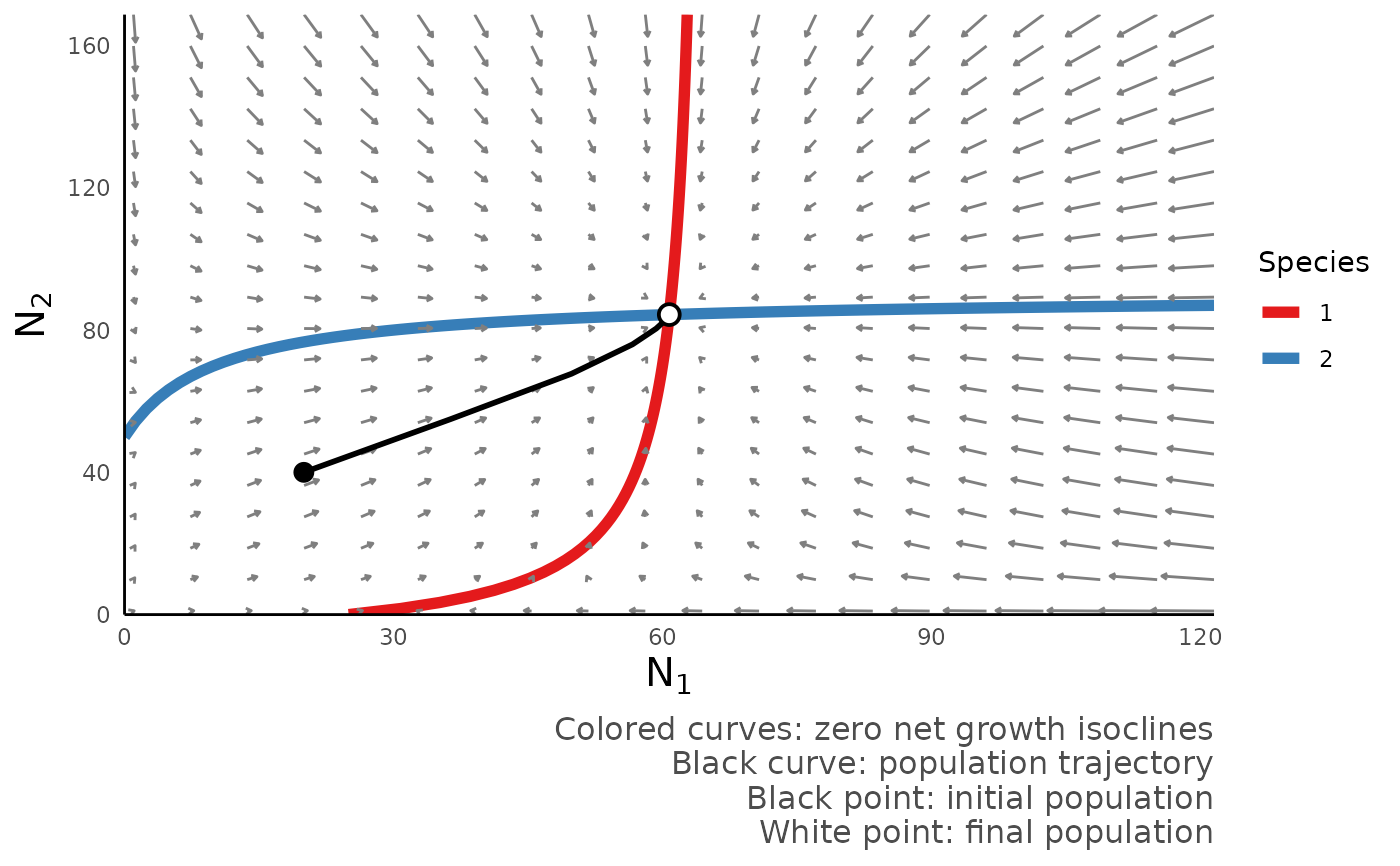
# Plot phase portrait with vector field and population trajectories
sim <- run_mutualism()
plot_mutualism_portrait(sim)
 # Plot phase portrait without vector field
sim <- run_mutualism()
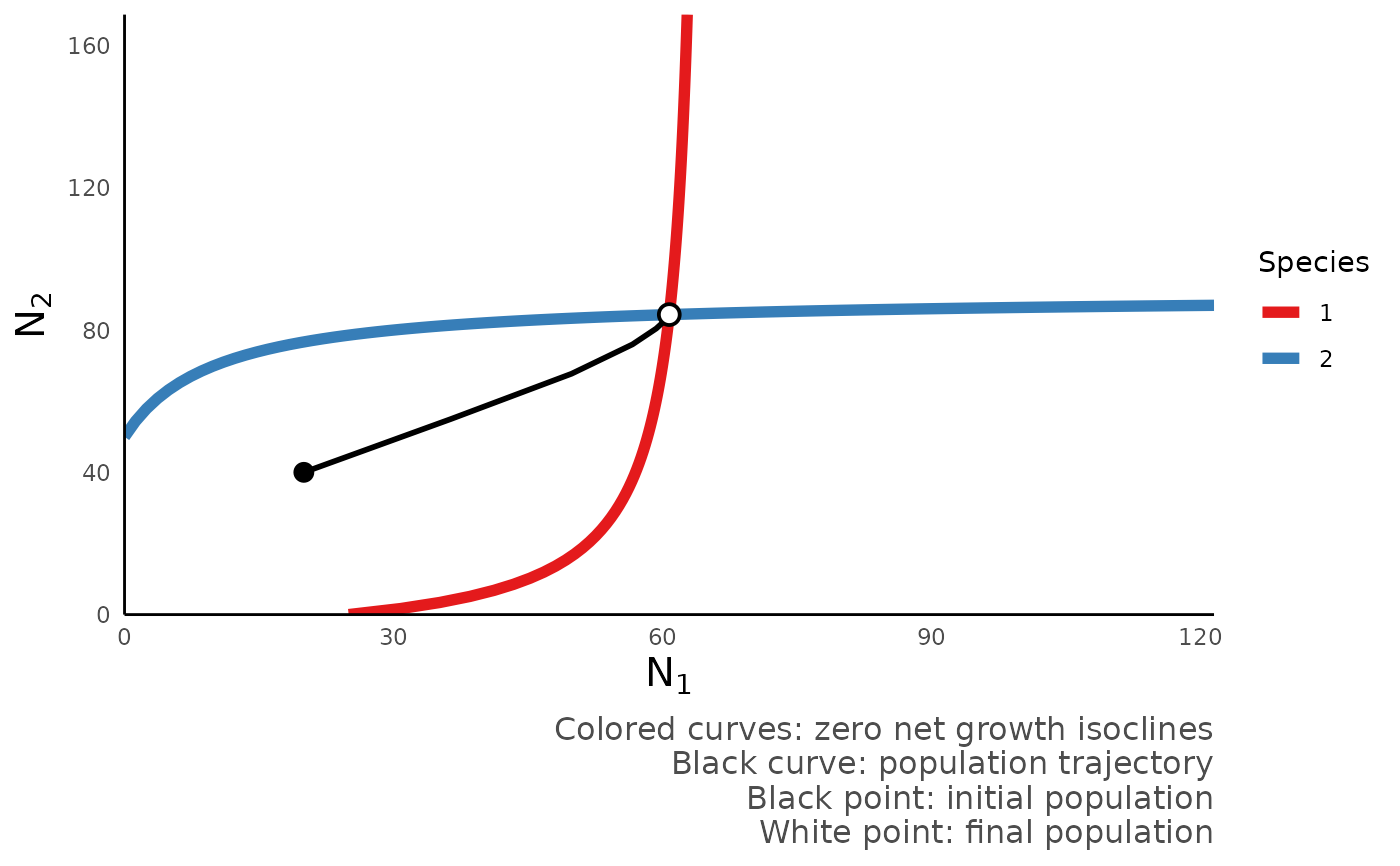
plot_mutualism_portrait(sim, vec = FALSE)
# Plot phase portrait without vector field
sim <- run_mutualism()
plot_mutualism_portrait(sim, vec = FALSE)
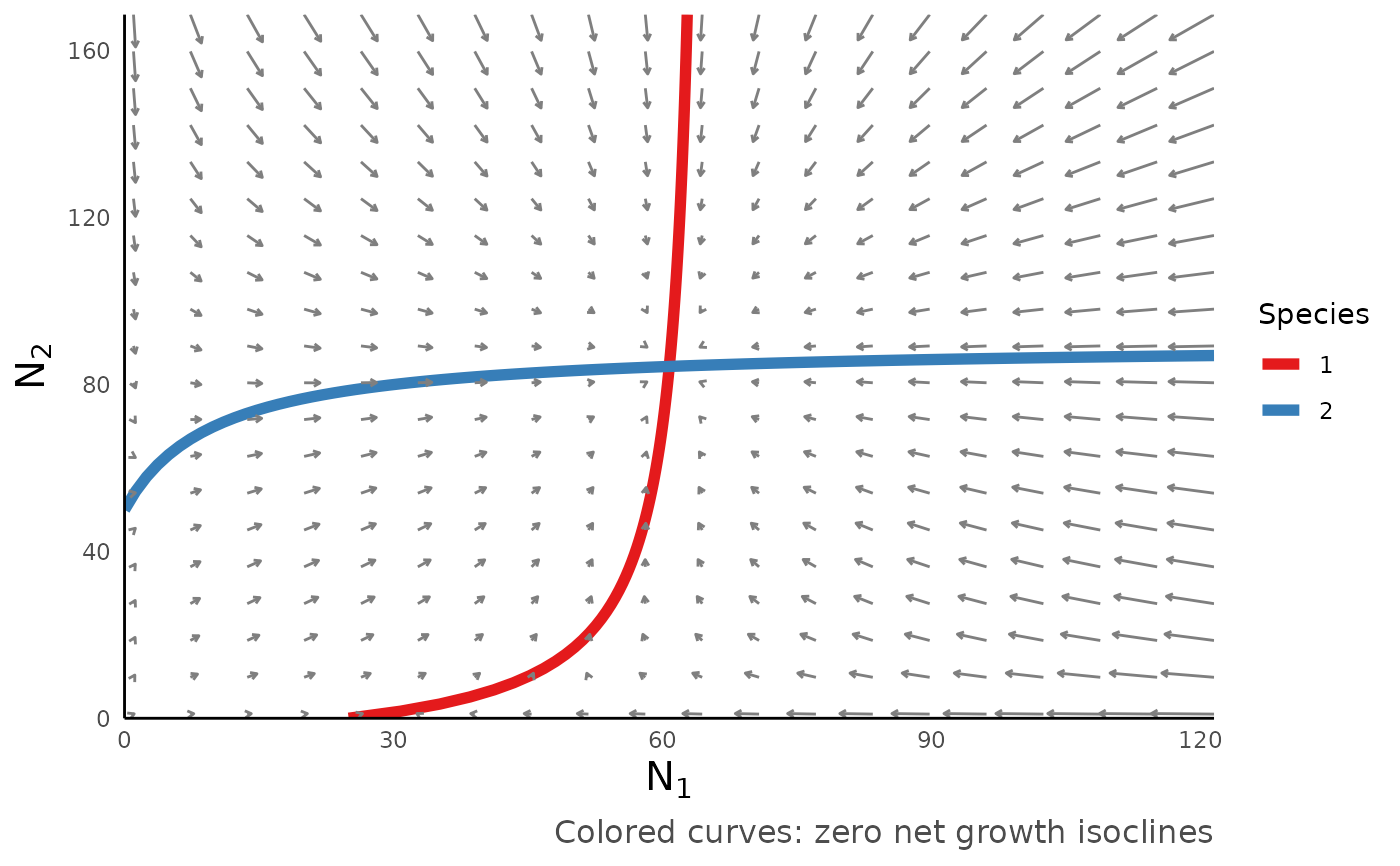
 # Plot phase portrait without population trajectories
sim <- run_mutualism()
plot_mutualism_portrait(sim, traj = FALSE)
# Plot phase portrait without population trajectories
sim <- run_mutualism()
plot_mutualism_portrait(sim, traj = FALSE)
 # Customize vector field
sim <- run_mutualism()
plot_mutualism_portrait(sim, vec.density = 10, vec.scale = 0.2)
# Customize vector field
sim <- run_mutualism()
plot_mutualism_portrait(sim, vec.density = 10, vec.scale = 0.2)
