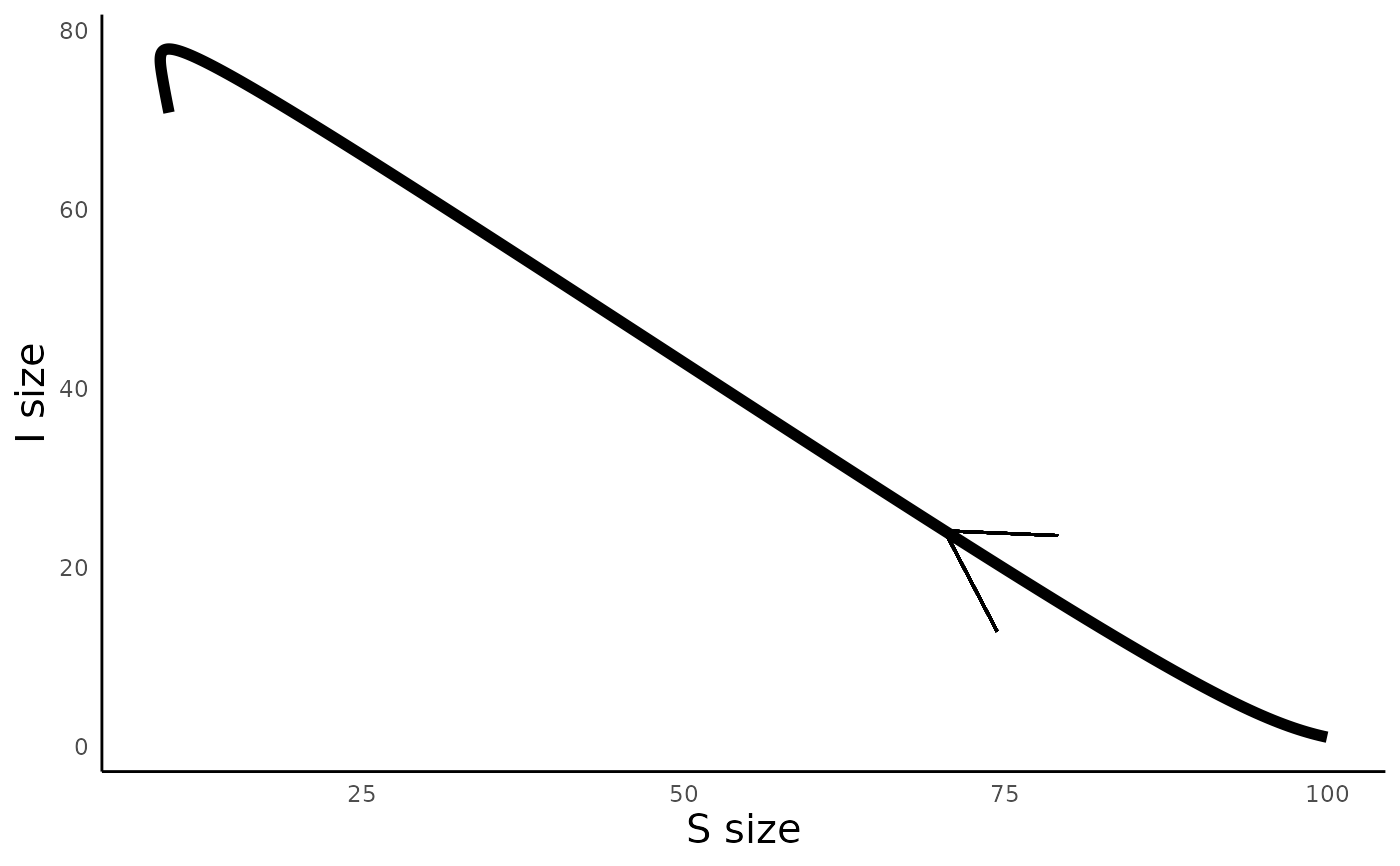
Plot phase portrait for infectious disease model model
plot_infectiousdisease_portrait.RdPlot phase portrait for infectious disease model model
Arguments
- sim_df
simulated data frame generated from run_infectiousdisease_model()
- x_axis
name of the column in
sim_dfto plot on X-axis of trajectory- y_axis
name of the column in
sim_dfto plot on Y-axis of trajectory
See also
run_infectiousdisease_model() to simulate the dynamics of the
model, and plot_infectiousdisease_time() to plot trajectories over time
Examples
# Run SIR model
params_vec <- c(m = .1, beta = .01, v = .2, gamma = 0)
init_vec <- c(S = 100, I = 1, R = 0)
time_vec <- seq(0, 100, 0.1)
sir_out <- run_infectiousdisease_model(time = time_vec, init = init_vec,
params = params_vec, model_type = "SIR")
plot_infectiousdisease_portrait(sir_out, "S", "I")