Add a new Smith-Fretwell curve to a ggplot object created with run_smith_fretwell_model
run_smith_fretwell_model_sp2.RdAdd a new Smith-Fretwell curve to a ggplot object created with run_smith_fretwell_model
Usage
run_smith_fretwell_model_sp2(
  existing_plot,
  Iymin = 6,
  Womax = 0.6,
  Iymax = 1000,
  shapeval = 0.02
)
Arguments
- existing_plot
ggplot object created with run_smith_fretwell_model that has the first (base) curve
- Iymin
Minimum seed size for a viable offspring
- Womax
Maximum fitness that an offspring can achieve
- Iymax
Total amount of energy an adult has to invest into reproduction
- shapeval
slope of the Smith-Fretwell curve
Examples
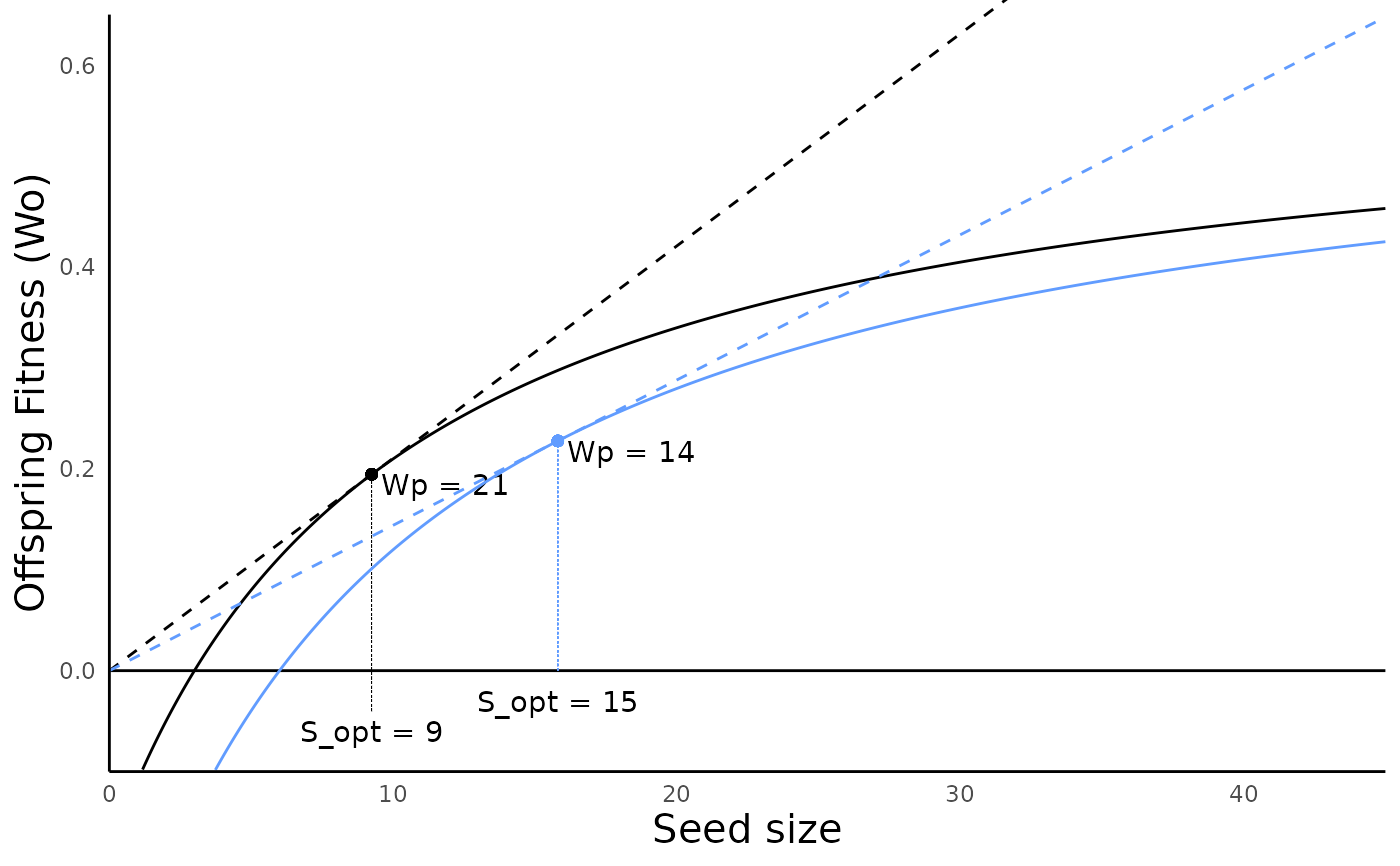
sf_species1 <- run_smith_fretwell_model(Iymin = 3, Womax = 0.6, Iymax = 1000)
run_smith_fretwell_model_sp2(sf_species1, Iymin = 6, Womax = 0.6, Iymax = 1000)
#> Warning: Removed 26 row(s) containing missing values (geom_path).
#> Warning: Removed 83 row(s) containing missing values (geom_path).