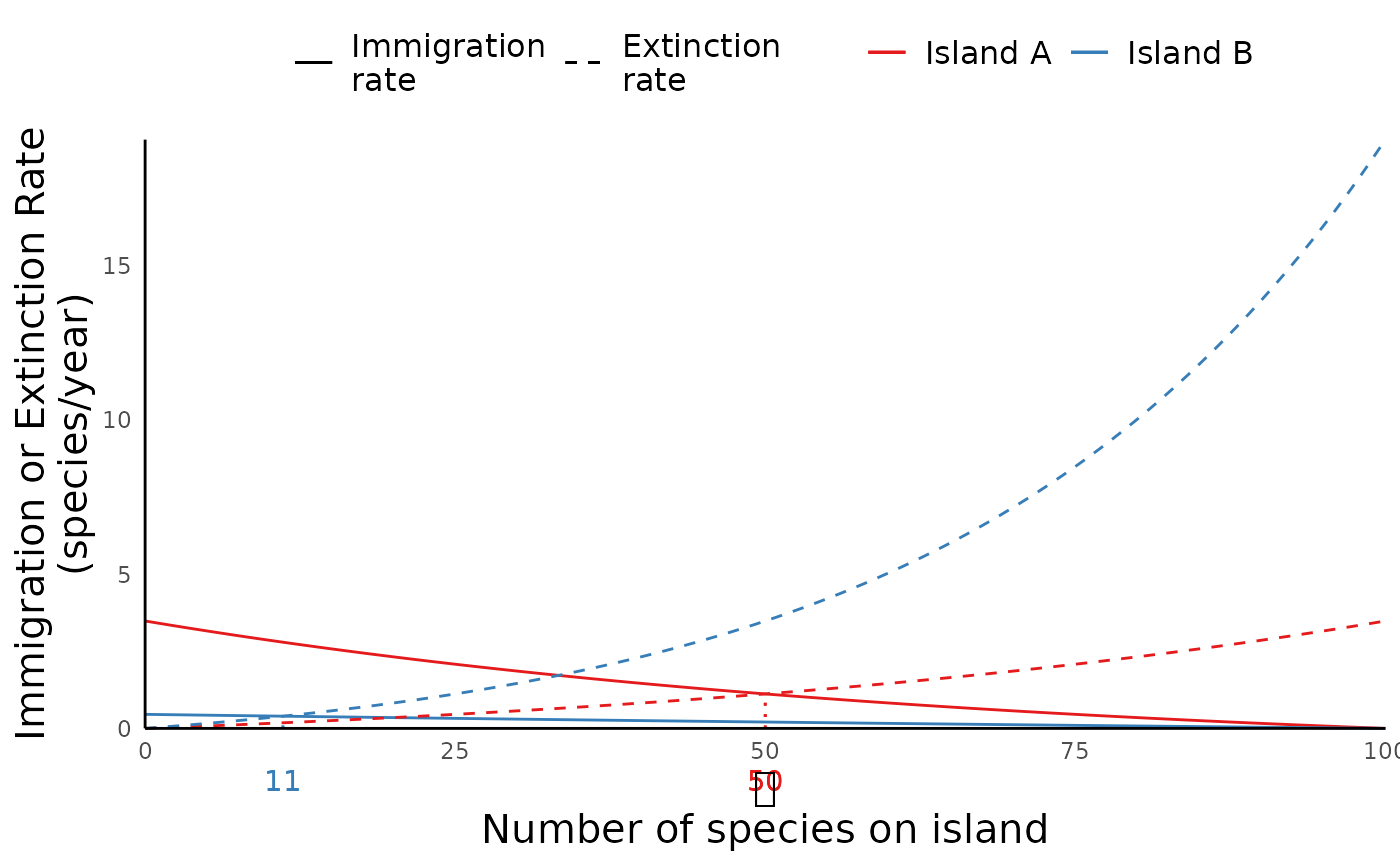
Runs the island biogeography model.
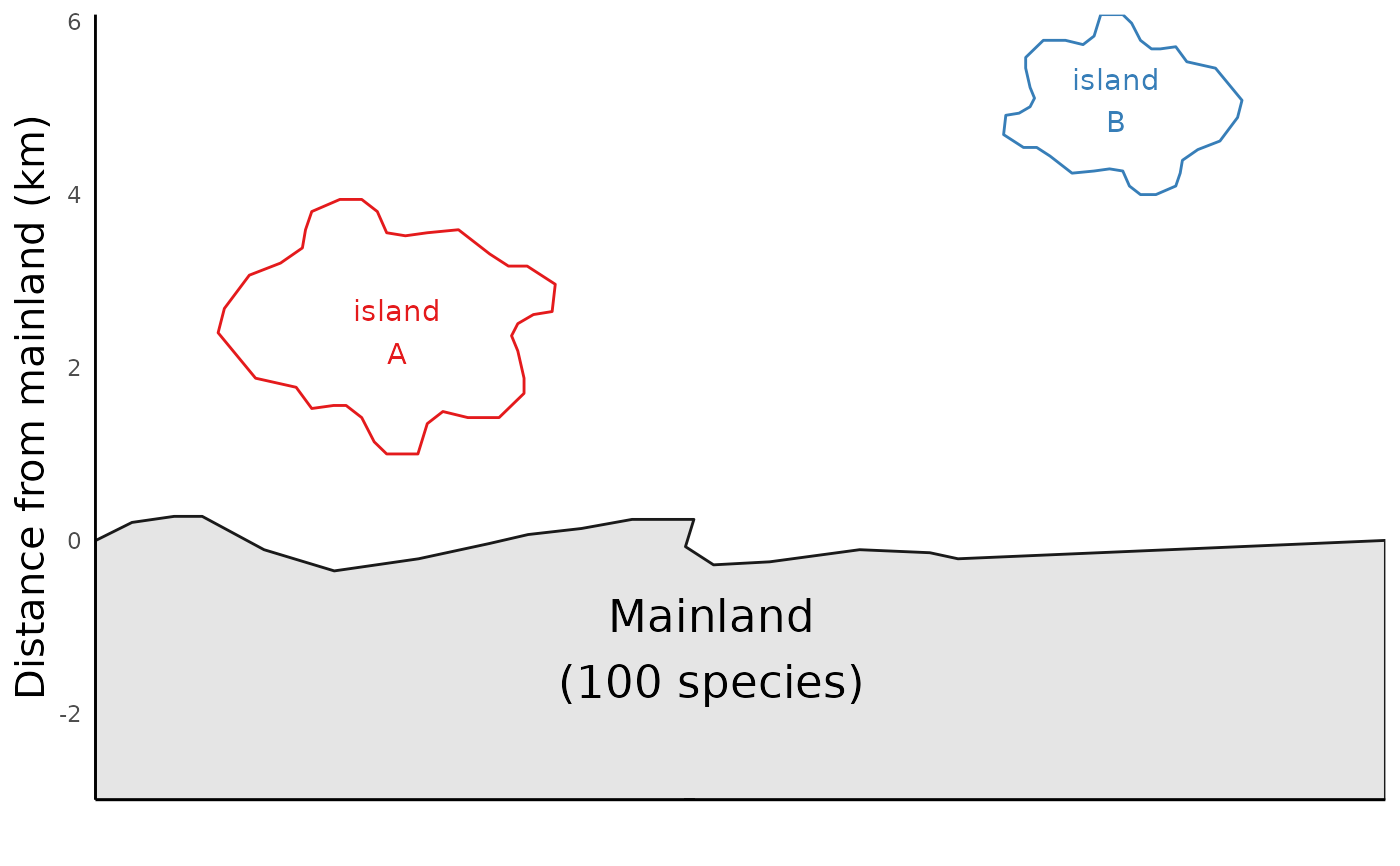
run_ibiogeo_model.RdThe function takes as inputs the size of two islands as well as their distance to the mainland, and uses these paramters to illustrate the equilibrium diversity of two islands.
Arguments
- D
distance from mainland (km)
- A
size of island (km^2)
- k
scaling parameter (defaults to 0.015)
- M
species richness of mainland