plot population trajectories of Pulliams' source sink meta-population
plot_source_sink.Rdplot population trajectories of Pulliams' source sink meta-population
Arguments
- sim_df
a 3-column data frame, or a list of 3: at each time step, the source and sink population sizes; can directly use the output from run_source_sink()
- assumption_status
a Boolean value, TRUE if assumptions are met, FALSE if violated
See also
run_source_sink() for generating the list that is used as the
input sim_df for this function
Examples
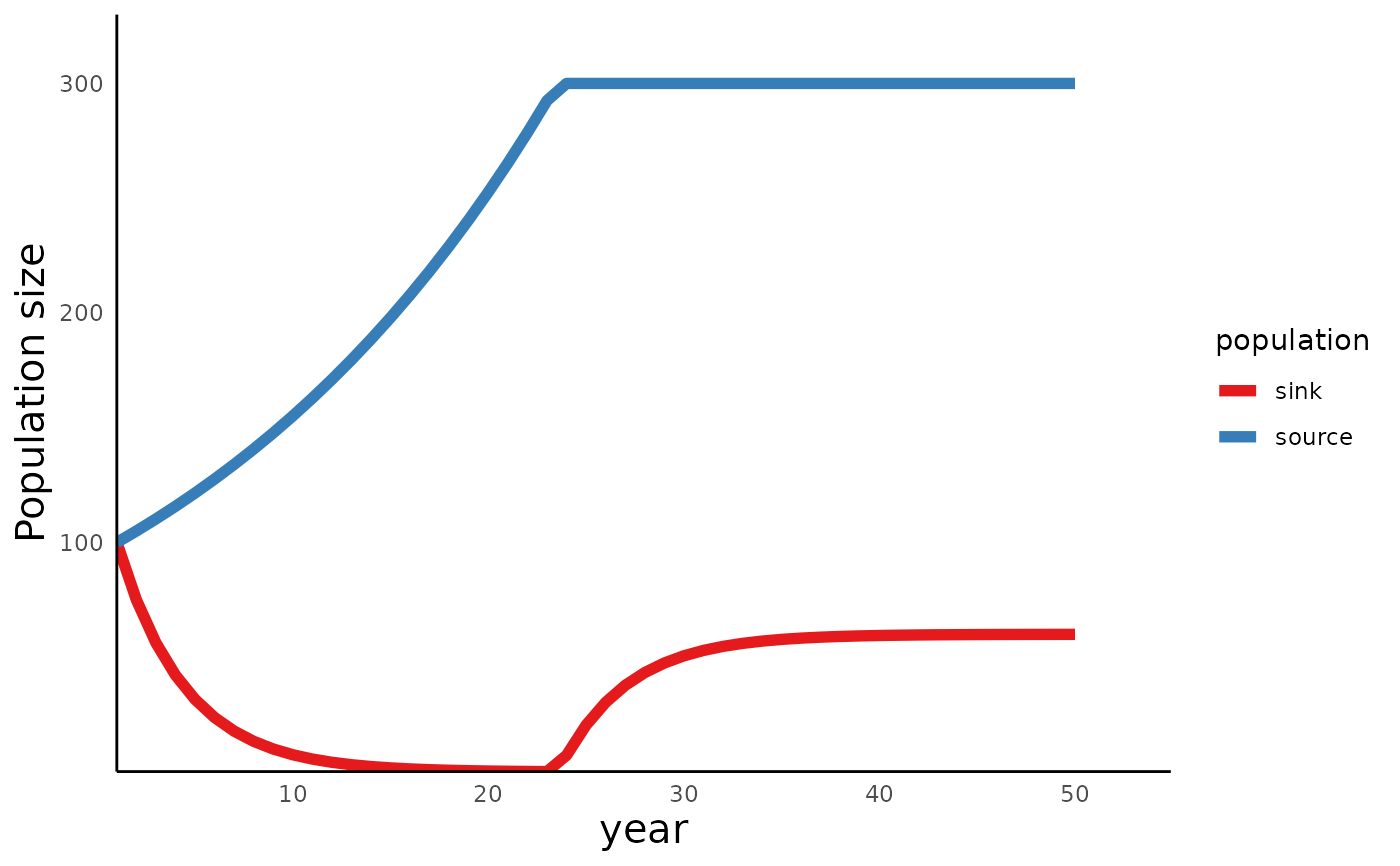
# a valid example
Params <- c(pa = 0.6, pj = 0.15, betaSource = 3, betaSink = 1, NSource = 300)
Sim_df <- run_source_sink(endtime = 50, init = c(n0Source = 100, n0Sink = 100),
params = Params)
Assumption_status <- assumption_check(Params)
plot_source_sink(sim_df = Sim_df, assumption_status = Assumption_status)
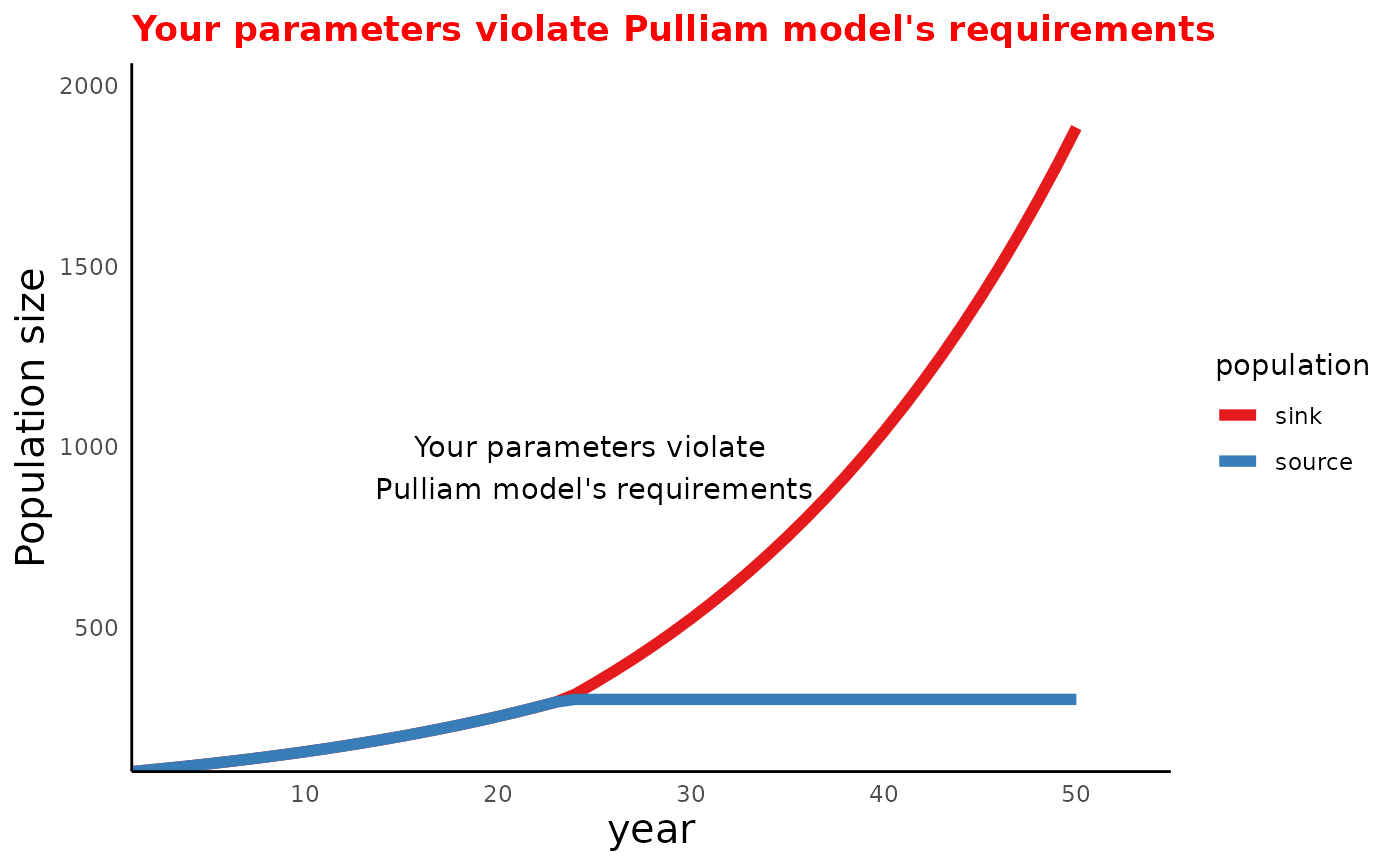
 # an invalid example with warning
Params <- c(pa = 0.6, pj = 0.15, betaSource = 3, betaSink = 3, NSource = 300)
Sim_df <- run_source_sink(endtime = 50, init = c(n0Source = 100, n0Sink = 100),
params = Params)
#> Warning: Your parameters violate Pulliam model's requirements;
#> lambda for source population must be greater than 1;
#> lambda for sink population must be smaller than 1
Assumption_status <- assumption_check(Params)
plot_source_sink(sim_df = Sim_df, assumption_status = Assumption_status)
# an invalid example with warning
Params <- c(pa = 0.6, pj = 0.15, betaSource = 3, betaSink = 3, NSource = 300)
Sim_df <- run_source_sink(endtime = 50, init = c(n0Source = 100, n0Sink = 100),
params = Params)
#> Warning: Your parameters violate Pulliam model's requirements;
#> lambda for source population must be greater than 1;
#> lambda for sink population must be smaller than 1
Assumption_status <- assumption_check(Params)
plot_source_sink(sim_df = Sim_df, assumption_status = Assumption_status)