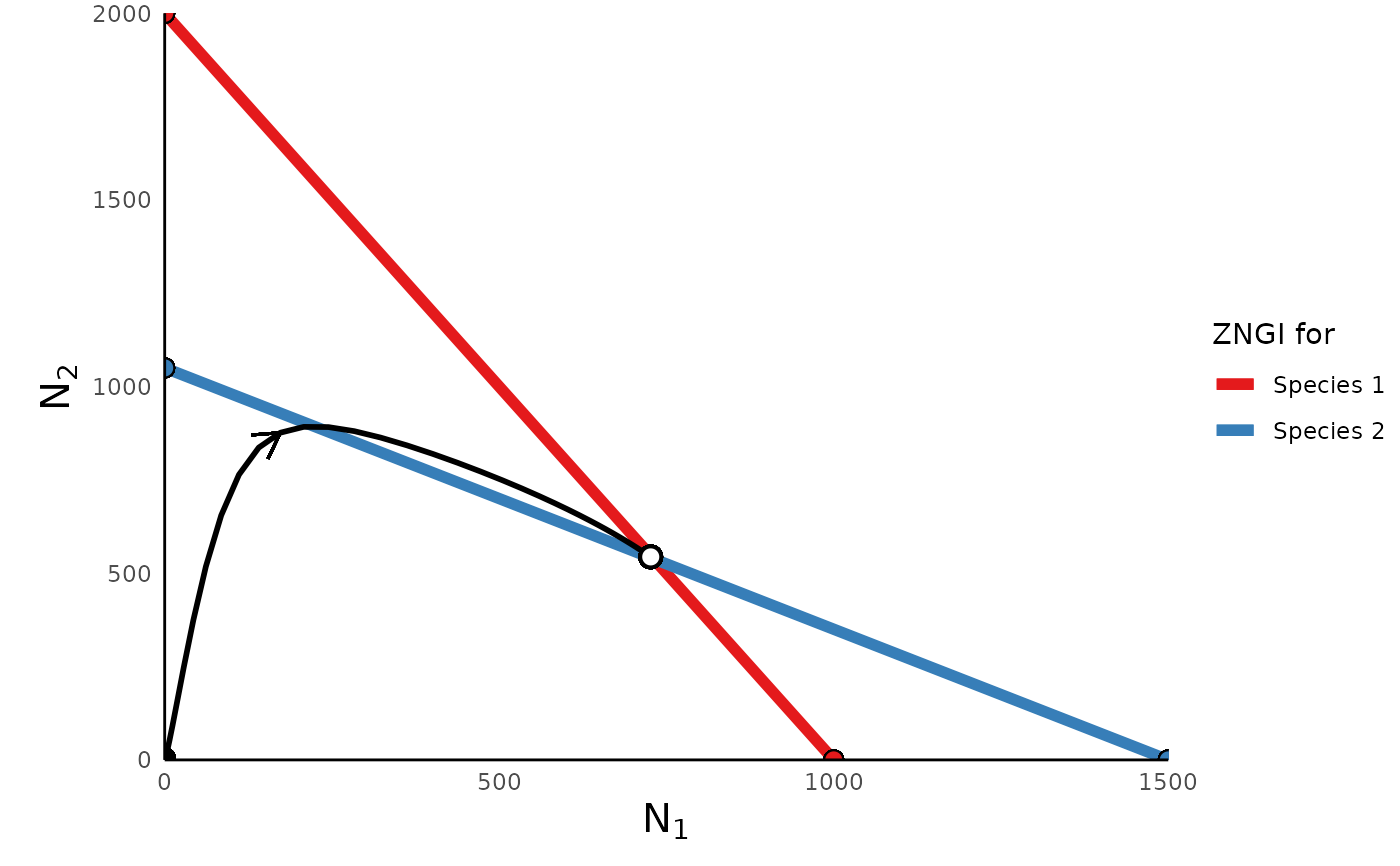
Generate a phase portrait (N1 vs N2) plot for the Lotka-Volterra model
plot_lvcomp_portrait.RdGenerate a phase portrait (N1 vs N2) plot for the Lotka-Volterra model
Arguments
- sim_df
data frame of lokta-volterra model simulation (created by run_lvcomp_model())
- params
vector of model parameters Note that carrying capacity for both species can be defined in
paramseither asK1andK2, or in the inverse, asa11anda22. If carrying capacities are defined asK1andK2, interspecific competition should be defined asaandb; otherwise,a12anda21.- margin_text
add text annotations to margins of isoclines?
See also
run_lvcomp_model() for simulating Lotka-Volterra competition
dynamics between two species given a vector of parameters, and
plot_lvcomp_time() for making a plot of population dynamics over time
Examples
params_vec = c(r1 = .5, r2 = .6, K1 = 1000, K2 = 1050, a = 0.5, b = 0.7)
sim_df <- run_lvcomp_model(time = 0:50, init = c(N1 = 1, N2 = 5), params =
params_vec)
plot_lvcomp_portrait(sim_df, params_vec)