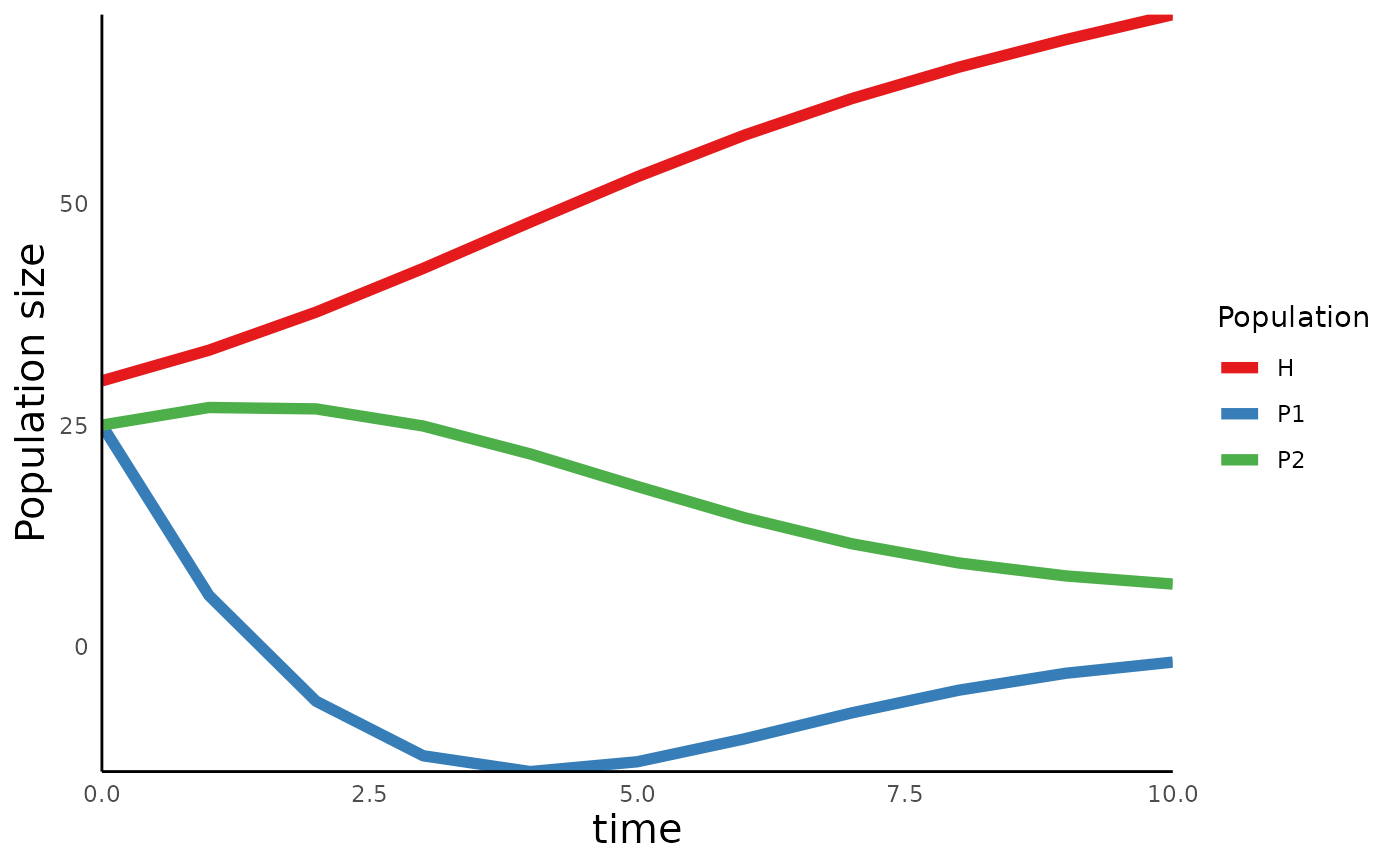
Plot population size over time for the boitic resource competition model
plot_biotic_comp_time.RdPlot population size over time for the boitic resource competition model
Arguments
- sim_df
matrix or data frame of simulations generated by run_biotic_comp_model
See also
run_biotic_comp_model() for simulating the biotic resource
competition model
Examples
sim_df_biotic_rc <- run_biotic_comp_model(
time = seq(0,10),
init = c(P1 = 25, P2 = 25, H = 30),
params = c(r = 0.2, q = .0066,
a1 = .02, T_h1 = 0.1, e1 = 0.4, d1 = 0.1,
a2 = .02, T_h2 = 0.1, e2 = 0.39, d2 = 0.1))
plot_biotic_comp_time(sim_df_biotic_rc)
