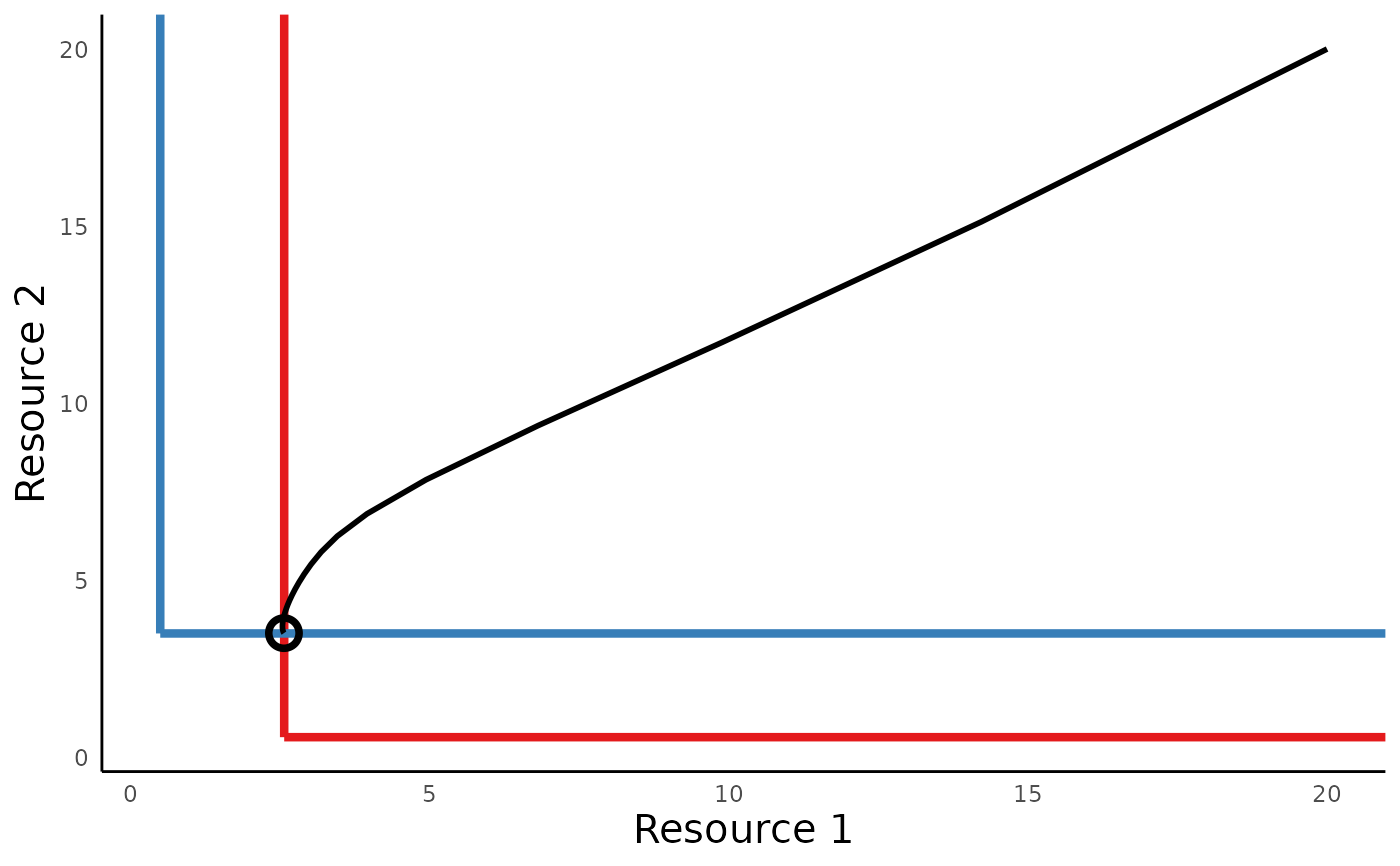
Plot the phase portrait of resources in the abiotic resource competition model
plot_abiotic_comp_portrait.RdPlot the phase portrait of resources in the abiotic resource competition model
Arguments
- rstar_vec
vector of R star values for the focal species, generated by run_abiotic_comp_rstar
- sim_df
matrix or data frame of simulations generated by run_abiotic_comp_model
See also
run_abiotic_comp_rstar() for calculating both species' R* values
for both resource, run_abiotic_comp_model() for simulating the abiotic
resource competition model, and plot_abiotic_comp_time() for plots of the
population dynamics over time
Examples
params_vec <- c(S1 = 12, S2 = 12, r1 = 1.6, r2 = 1, k11 = 18, k12 = 4, k21 =
2, k22 = 14, m1 = .2, m2 = .2,c11 = .25, c12 = .08, c21 = .1, c22 = .2, a1 =
.5, a2 = .5)
rstar_abioticrc <- run_abiotic_comp_rstar(params_vec)
sim_df_abioticrc <- run_abiotic_comp_model(time = seq(0,50), init = c(N1 =
10, N2 = 10, R1 = 20, R2 = 20), params = params_vec)
plot_abiotic_comp_portrait(rstar_abioticrc, sim_df_abioticrc)
